
Search for Indicators
Children's Health
Indicator Gauge Icon Legend
Legend Colors
Red is bad, green is good, blue is not statistically different/neutral.
Compared to Distribution
 the value is in the best half of communities.
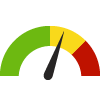 the value is in the 2nd worst quarter of communities.
 the value is in the worst quarter of communities.
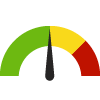
Compared to Target
 meets target;
  does not meet target.
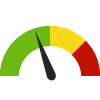
Compared to a Single Value
 lower than the comparison value;
 higher than the comparison value;
 not statistically different from comparison value.
Trend

 non-significant change over time;
 significant change over time;
  no change over time.
Compared to Prior Value
 higher than the previous measurement period;
 lower than the previous measurement period;
 no statistically different change from previous measurement period.
Health / Disabilities
Health / Disabilities
County: Sacramento
Value
Compared to:
County: Sacramento Children with a Disability
County: Sacramento Children with a Disability
3.8%
(2018-2022)
Compared to:


CA Value
(3.7%)
The regional value is compared to the California state value.
US Value
(4.5%)
The regional value is compared to the national value.
Trend
This comparison measures the indicator’s values over multiple time periods.<br>The Mann-Kendall Test for Statistical Significance is used to evaluate the trend<br>over 4 to 10 periods of measure, subject to data availability and comparability.
Health / Health Care Access & Quality
Health / Health Care Access & Quality
County: Sacramento
Value
Compared to:
County: Sacramento Children with Health Insurance
County: Sacramento Children with Health Insurance
97.1%
(2022)
Compared to:
CA Counties
The distribution is based on data from 42 California counties.
U.S. Counties
The distribution is based on data from 828 U.S. counties and county equivalents.
CA Value
(96.8%)
The regional value is compared to the California state value.
US Value
(94.9%)
The regional value is compared to the national value.
Prior Value
(97.6%)
Prior Value compares a measured value with the previously measured value. Confidence intervals were taken into account in determining the direction of the comparison.
Trend
This comparison measures the indicator’s values over multiple time periods.<br>The Mann-Kendall Test for Statistical Significance is used to evaluate the trend<br>over 4 to 10 periods of measure, subject to data availability and comparability.
Health / Immunizations & Infectious Diseases
Health / Immunizations & Infectious Diseases
County: Sacramento
Value
Compared to:
County: Sacramento Kindergartners with Required Immunizations
County: Sacramento Kindergartners with Required Immunizations
92.7%
(2021-2022)
Compared to:

CA Counties
The distribution is based on data from 56 California counties.
CA Value
(92.8%)
The regional value is compared to the California state value.
Prior Value
(91.5%)
Prior Value compares a measured value with the previously measured value. Confidence intervals were not taken into account in determining the direction of the comparison.
Trend
This comparison measures the indicator’s values over multiple time periods.<br>The Mann-Kendall Test for Statistical Significance is used to evaluate the trend<br>over 4 to 10 periods of measure, subject to data availability and comparability.
Health / Nutrition & Healthy Eating
Health / Nutrition & Healthy Eating
County: Sacramento
Value
Compared to:
County: Sacramento Child and Teen Fruit Consumption
County: Sacramento Child and Teen Fruit Consumption
76.7%
(2019-2020)
Compared to:

CA Counties
The distribution is based on data from 58 California counties.
CA Value
(69.8%)
The regional value is compared to the California state value.
Prior Value
(72.7%)
Prior Value compares a measured value with the previously measured value. Confidence intervals were taken into account in determining the direction of the comparison.
Trend
This comparison measures the indicator’s values over multiple time periods.<br>The Mann-Kendall Test for Statistical Significance is used to evaluate the trend<br>over 4 to 10 periods of measure, subject to data availability and comparability.
Health / Oral Health
Health / Oral Health
County: Sacramento
Value
Compared to:
County: Sacramento Children who Visited a Dentist
County: Sacramento Children who Visited a Dentist
86.6%
(2019-2020)
Compared to:
CA Value
(89.5%)
The regional value is compared to the California state value.
Health / Respiratory Diseases
Health / Respiratory Diseases
County: Sacramento
Value
Compared to:
County: Sacramento Children and Teens with Asthma
County: Sacramento Children and Teens with Asthma
11.1%
(2015-2016)
Compared to:
CA Counties
The distribution is based on data from 43 California counties.
CA Value
(14.6%)
The regional value is compared to the California state value.
Prior Value
(12.7%)
Prior Value compares a measured value with the previously measured value. Confidence intervals were taken into account in determining the direction of the comparison.
Health / Weight Status
Health / Weight Status
County: Sacramento
Value
Compared to:
County: Sacramento 5th Grade Students who are at a Healthy Weight or Underweight
County: Sacramento 5th Grade Students who are at a Healthy Weight or Underweight
61.6%
(2018-2019)
Compared to:

CA Counties
The distribution is based on data from 58 California counties.
CA Value
(58.7%)
The regional value is compared to the California state value.
Prior Value
(61.9%)
Prior Value compares a measured value with the previously measured value. Confidence intervals were not taken into account in determining the direction of the comparison.
Trend
This comparison measures the indicator’s values over multiple time periods.<br>The Mann-Kendall Test for Statistical Significance is used to evaluate the trend<br>over 4 to 10 periods of measure, subject to data availability and comparability.
County: Sacramento Children who are Overweight for Age
County: Sacramento Children who are Overweight for Age
17.1%
(2019-2020)
Compared to:


CA Value
(13.9%)
The regional value is compared to the California state value.
Prior Value
(14.7%)
Prior Value compares a measured value with the previously measured value. Confidence intervals were taken into account in determining the direction of the comparison.
Trend
This comparison measures the indicator’s values over multiple time periods.<br>The Mann-Kendall Test for Statistical Significance is used to evaluate the trend<br>over 4 to 10 periods of measure, subject to data availability and comparability.
Community / Social Environment
Community / Social Environment
County: Sacramento
Value
Compared to:
County: Sacramento Substantiated Child Abuse Rate
County: Sacramento Substantiated Child Abuse Rate
5.8
Cases per 1,000 children
(2022)
Compared to:
CA Value
(6.1)
The regional value is compared to the California state value.
US Value
(8.2 in 2021)
The regional value is compared to the national value. The source for the national value is Children's Bureau
Prior Value
(6.3)
Prior Value compares a measured value with the previously measured value. Confidence intervals were not taken into account in determining the direction of the comparison.
Trend
This comparison measures the indicator’s values over multiple time periods.<br>The Mann-Kendall Test for Statistical Significance is used to evaluate the trend<br>over 4 to 10 periods of measure, subject to data availability and comparability.
HP 2030 Target
(8.7)
Economy / Food Insecurity
Economy / Food Insecurity
County: Sacramento
Value
Compared to:
County: Sacramento Child Food Insecurity Rate
County: Sacramento Child Food Insecurity Rate
14.3%
(2021)
Compared to:
CA Counties
The distribution is based on data from 58 California counties.
U.S. Counties
The distribution is based on data from 3,140 U.S. counties and county equivalents.
CA Value
(13.5%)
The regional value is compared to the California state value.
US Value
(12.8%)
The regional value is compared to the national value.
Prior Value
(17.3%)
Prior Value compares a measured value with the previously measured value. Confidence intervals were not taken into account in determining the direction of the comparison.
Trend
This comparison measures the indicator’s values over multiple time periods.<br>The Mann-Kendall Test for Statistical Significance is used to evaluate the trend<br>over 4 to 10 periods of measure, subject to data availability and comparability.
County: Sacramento Food Insecure Children Likely Ineligible for Assistance
County: Sacramento Food Insecure Children Likely Ineligible for Assistance
28%
(2021)
Compared to:

CA Counties
The distribution is based on data from 58 California counties.
U.S. Counties
The distribution is based on data from 3,134 U.S. counties and county equivalents.
CA Value
(34%)
The regional value is compared to the California state value.
US Value
(25%)
The regional value is compared to the national value.
Prior Value
(30%)
Prior Value compares a measured value with the previously measured value. Confidence intervals were not taken into account in determining the direction of the comparison.
Trend
This comparison measures the indicator’s values over multiple time periods.<br>The Mann-Kendall Test for Statistical Significance is used to evaluate the trend<br>over 4 to 10 periods of measure, subject to data availability and comparability.
County: Sacramento Projected Child Food Insecurity Rate
County: Sacramento Projected Child Food Insecurity Rate
19.6%
(2021)
Compared to:
CA Counties
The distribution is based on data from 58 California counties.
U.S. Counties
The distribution is based on data from 3,142 U.S. counties and county equivalents.
CA Value
(16.8%)
The regional value is compared to the California state value.
Prior Value
(26.7%)
Prior Value compares a measured value with the previously measured value. Confidence intervals were not taken into account in determining the direction of the comparison.
Education / Childcare & Early Childhood Education
Education / Childcare & Early Childhood Education
County: Sacramento
Value
Compared to:
County: Sacramento Child Care Centers
County: Sacramento Child Care Centers
7.0
Per 1,000 population under age 5
(2022)
Compared to:
CA Counties
The distribution is based on data from 58 California counties.
CA Value
(8.1)
The regional value is compared to the California state value.
US Value
(7.0)
The regional value is compared to the national value.
Prior Value
(4.4)
Prior Value compares a measured value with the previously measured value. Confidence intervals were not taken into account in determining the direction of the comparison.
